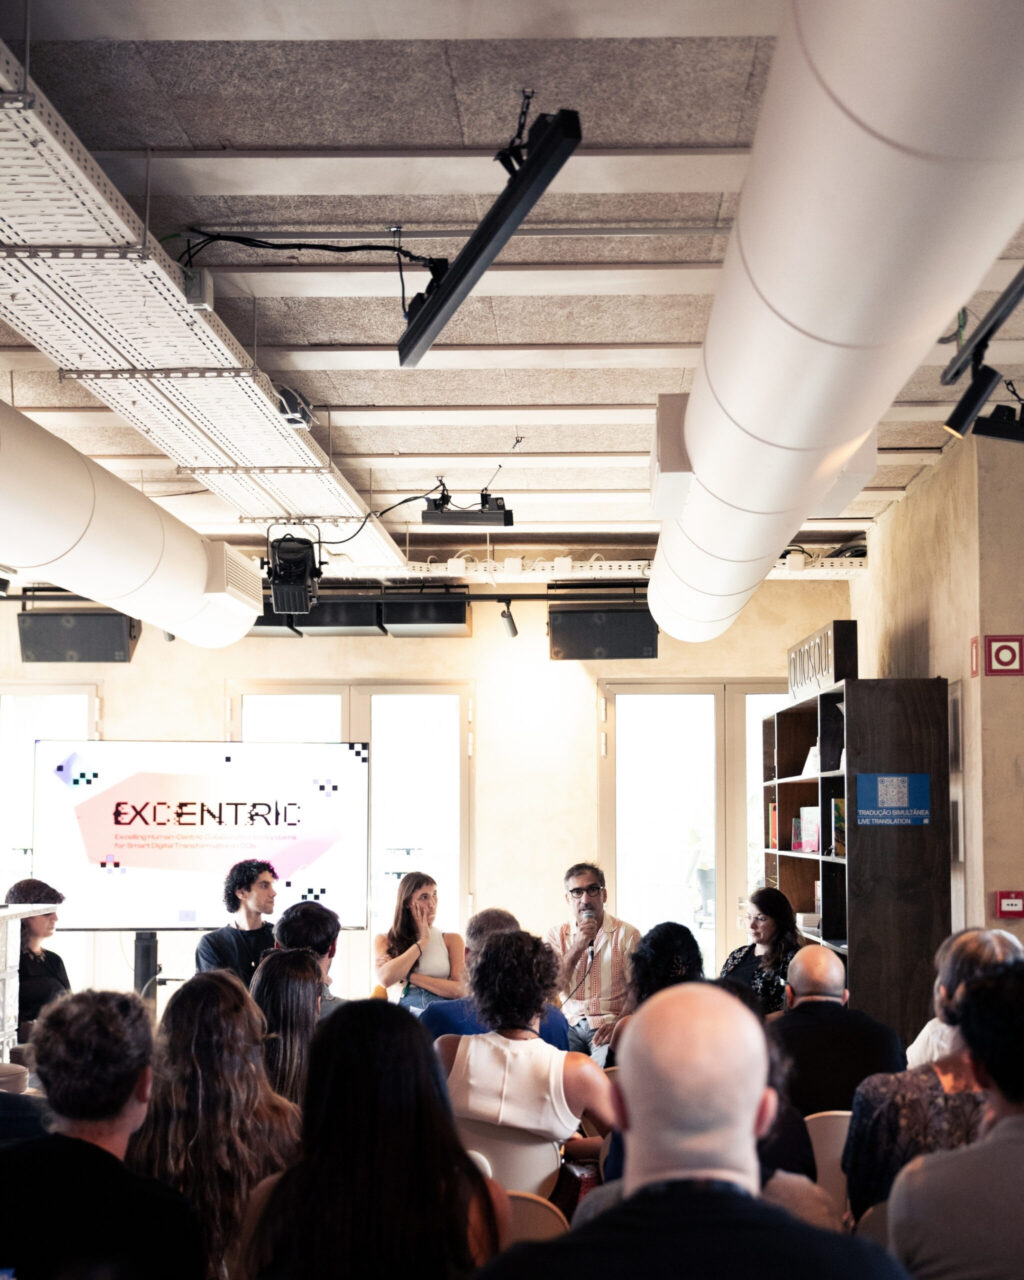
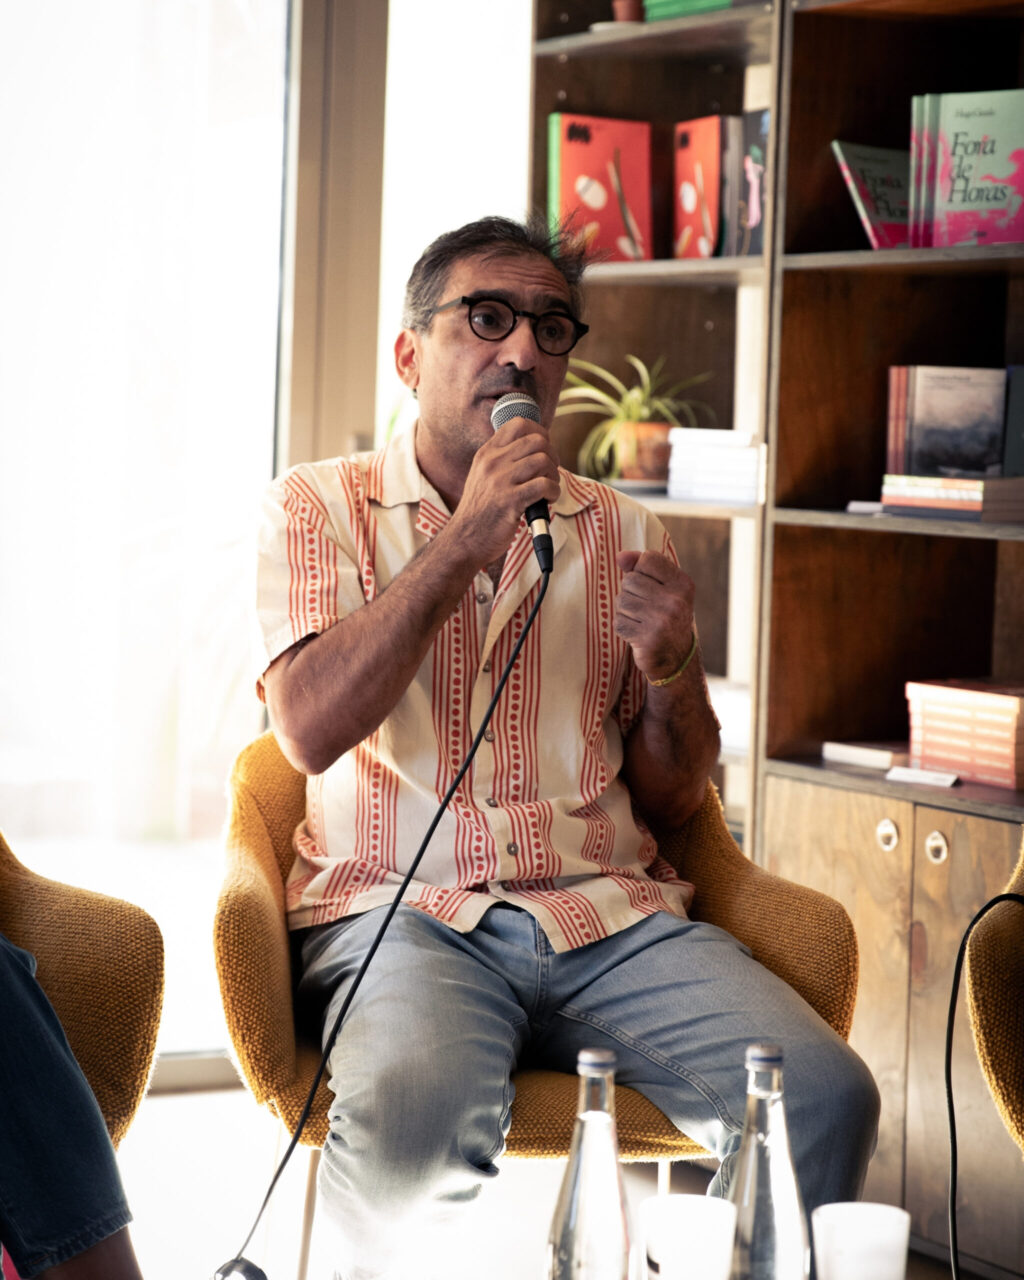
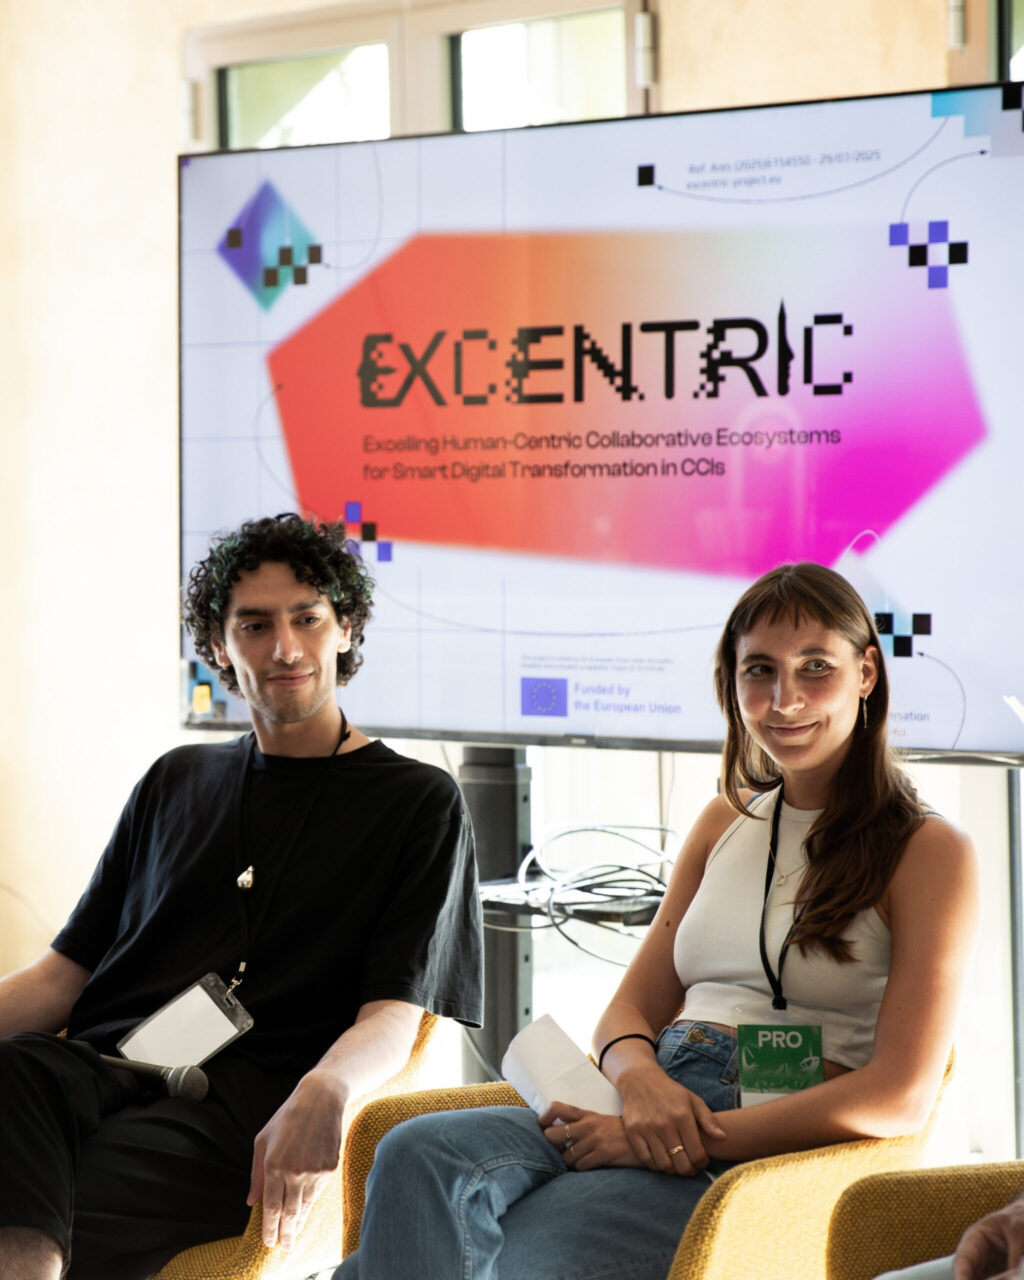
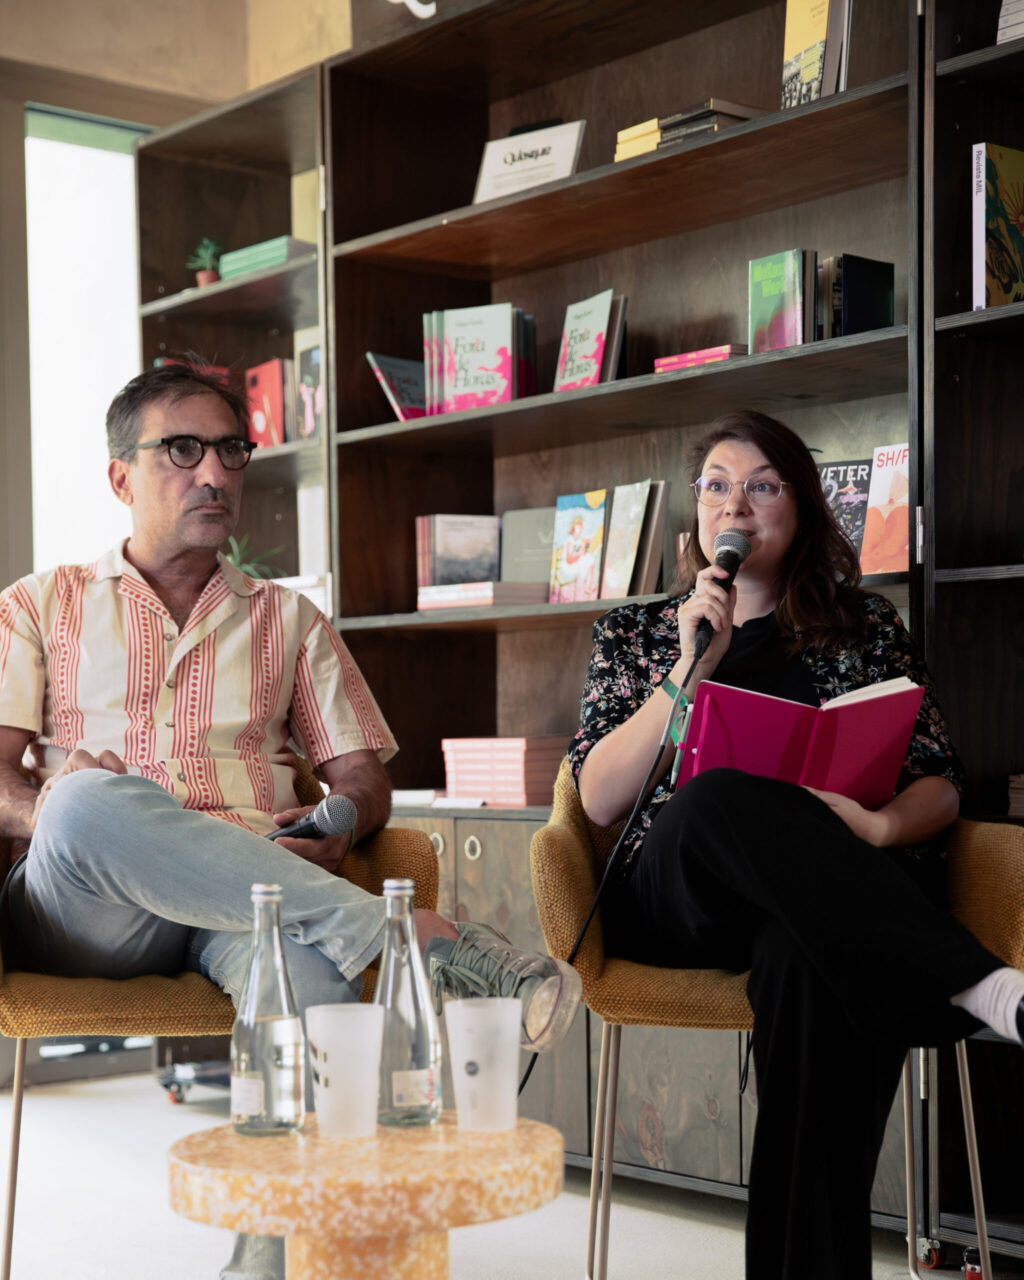
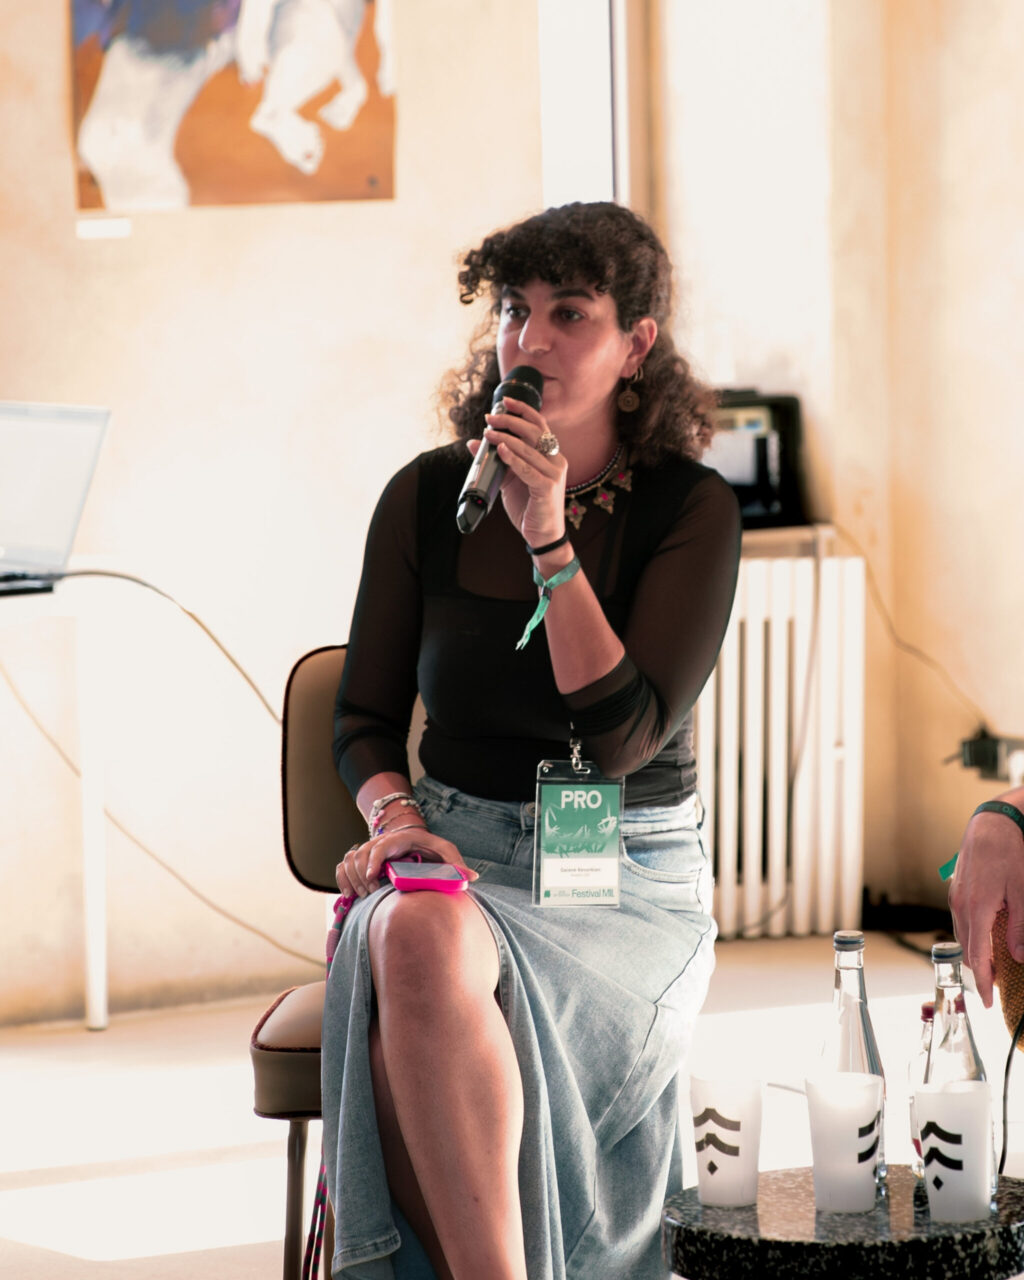
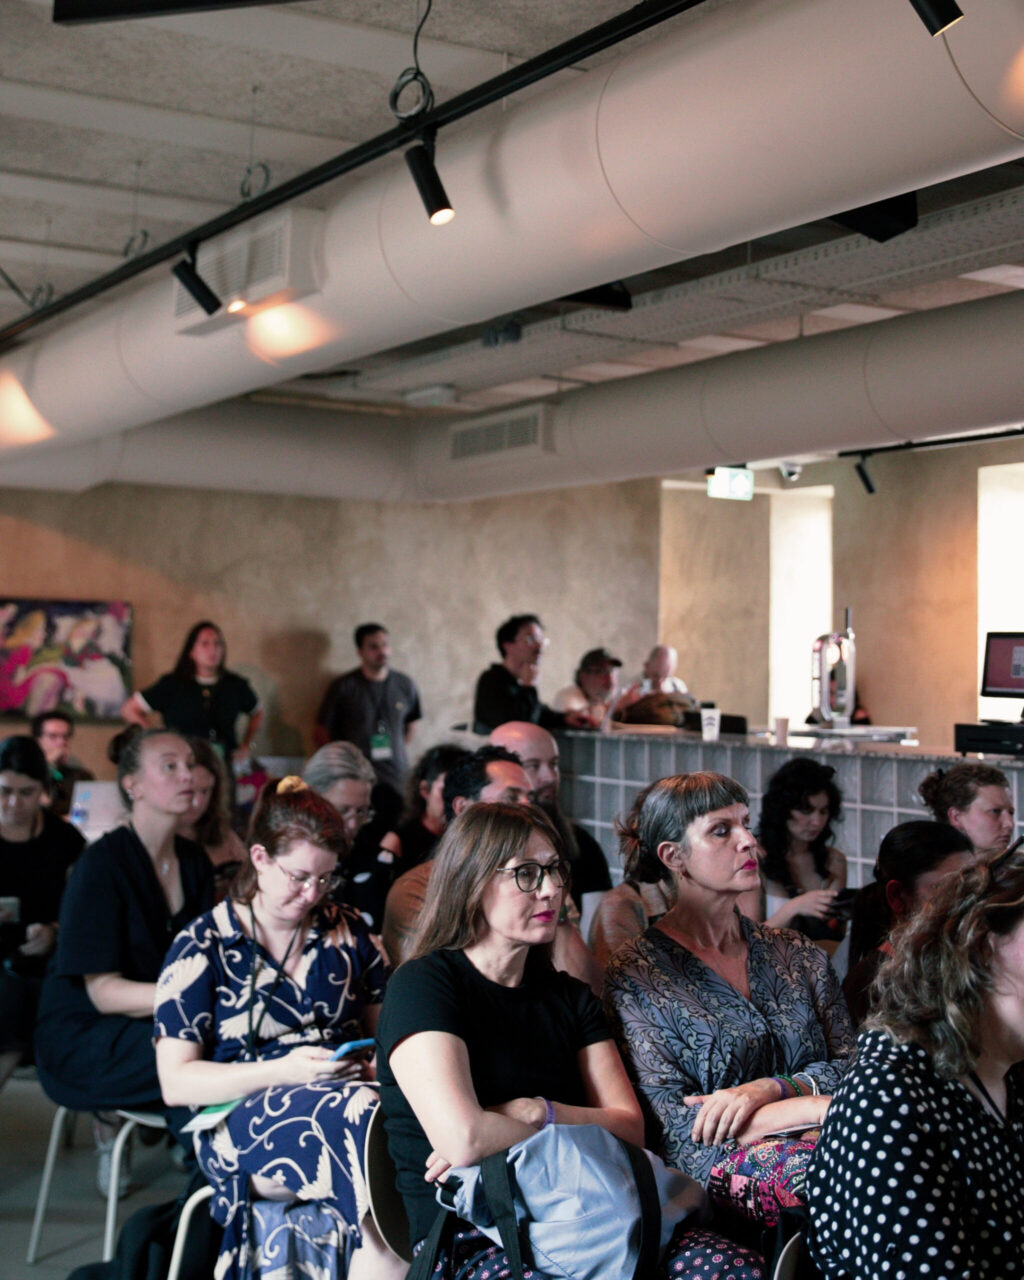
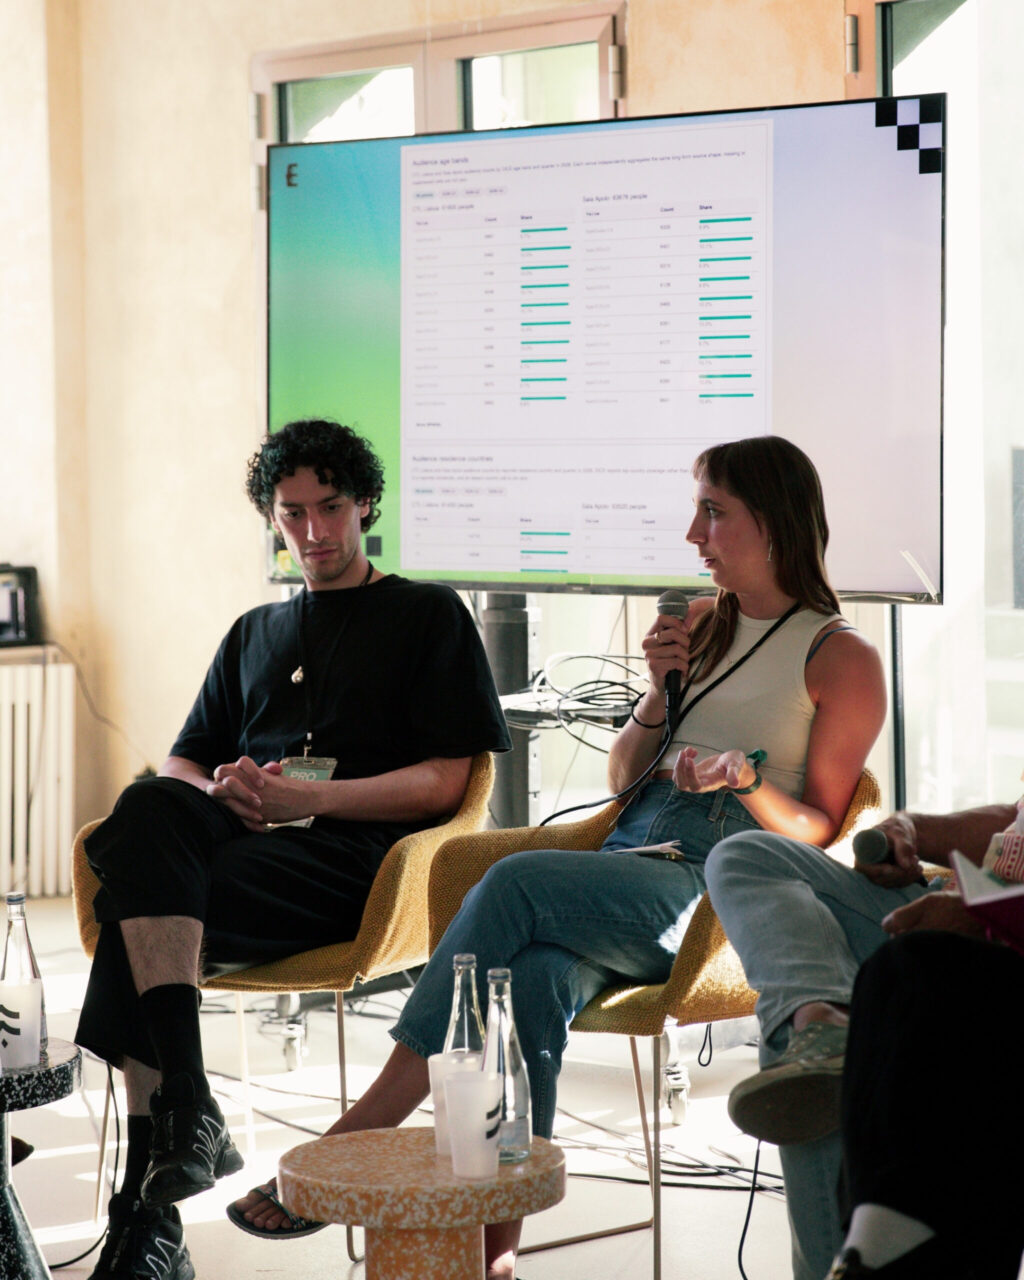
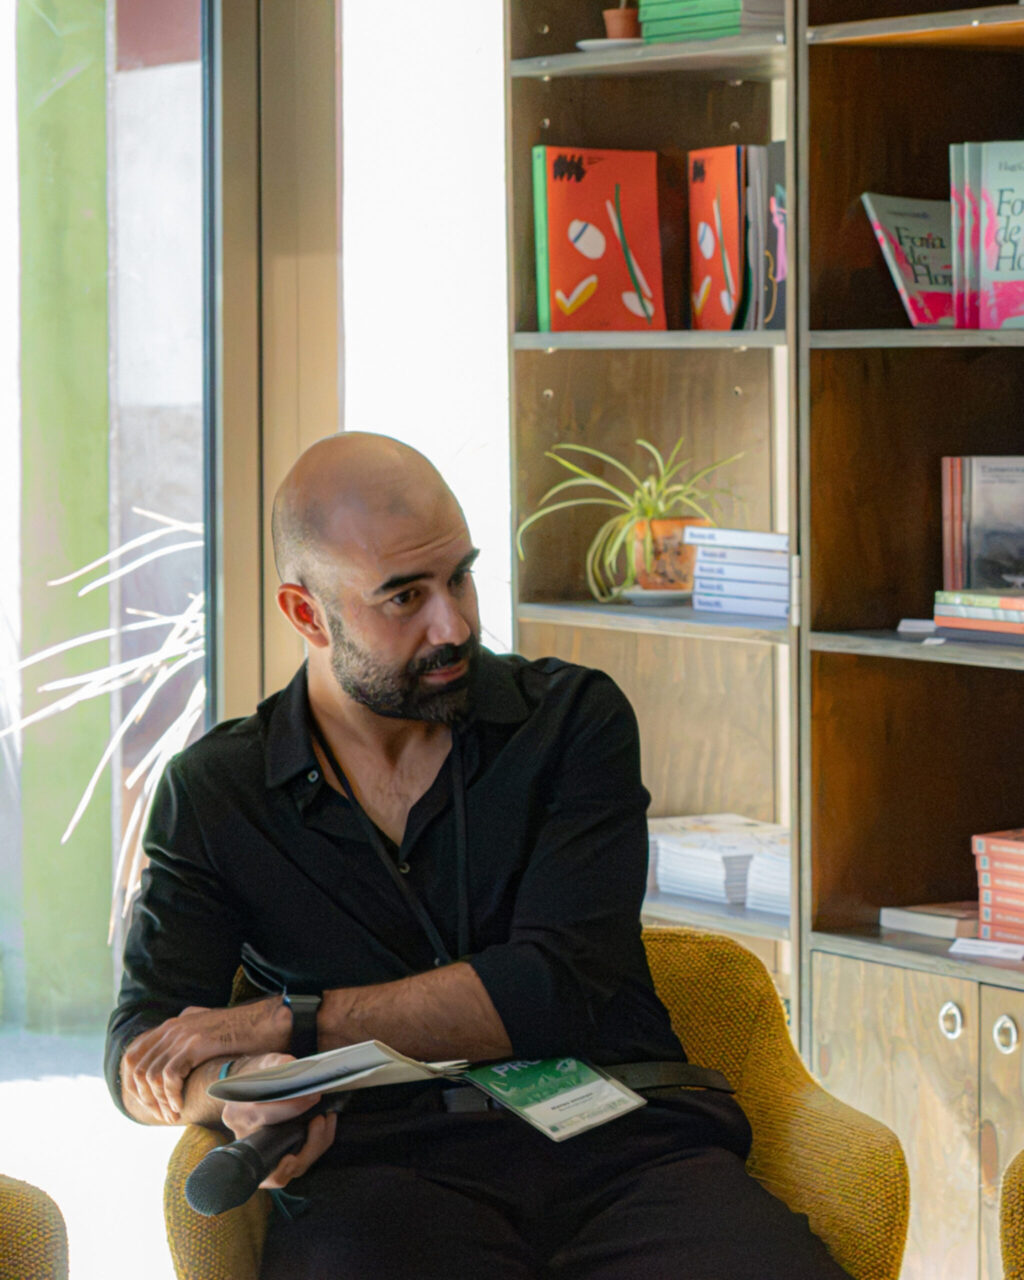
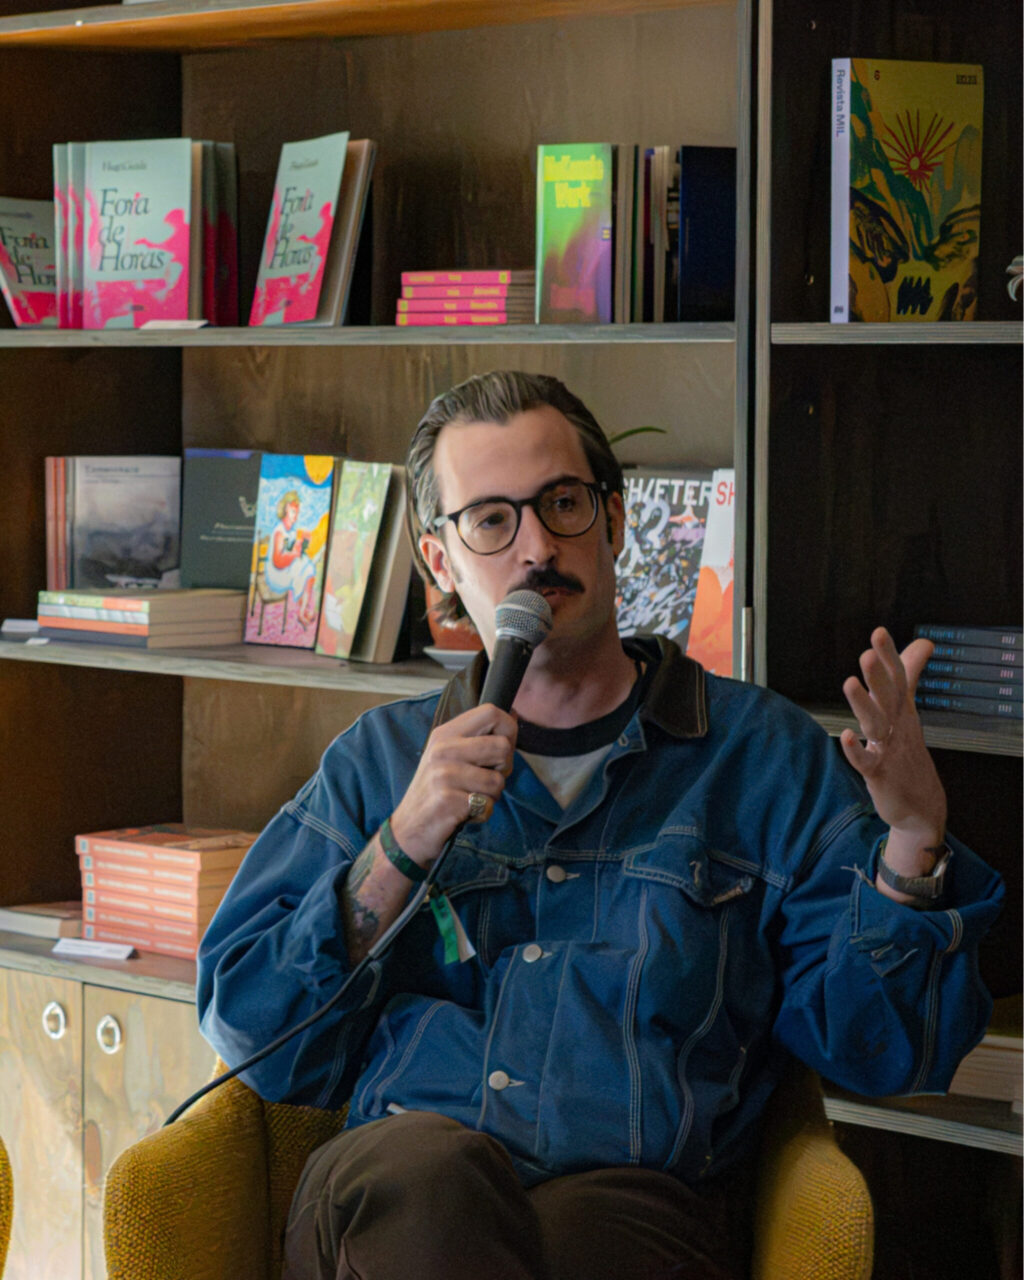
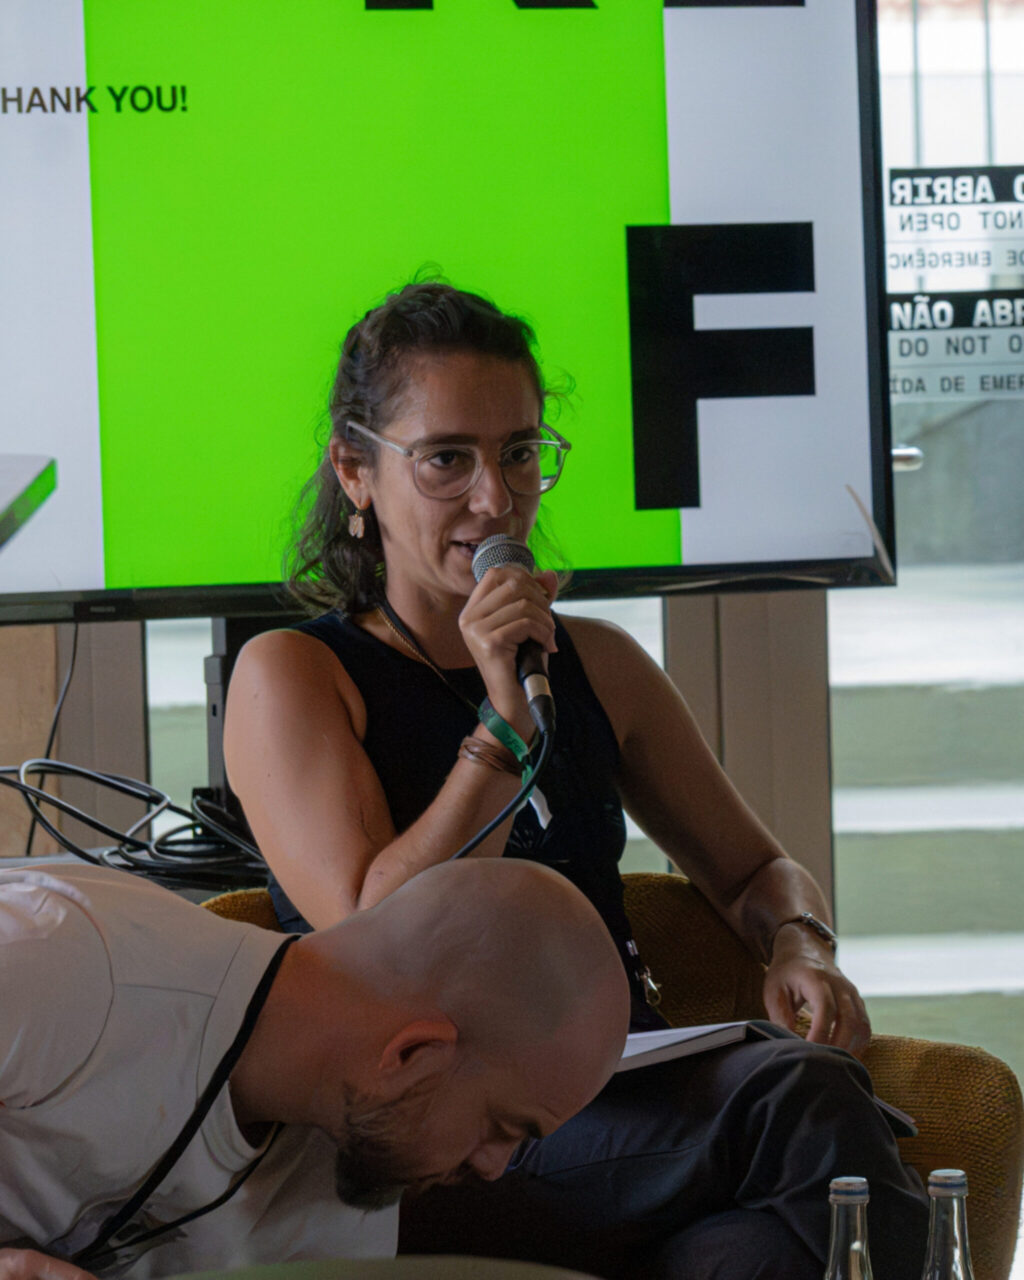
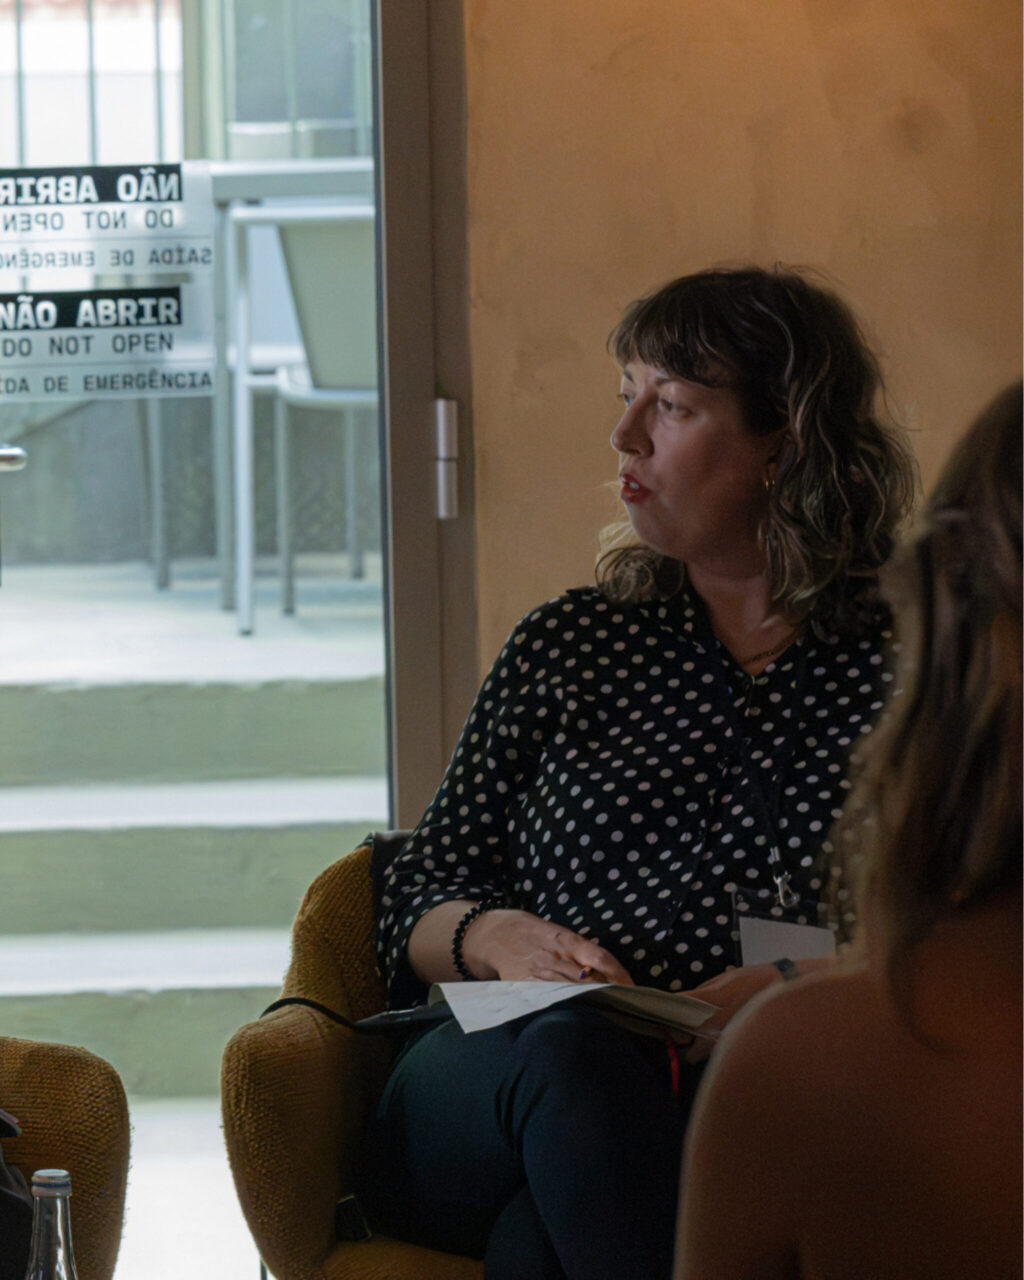
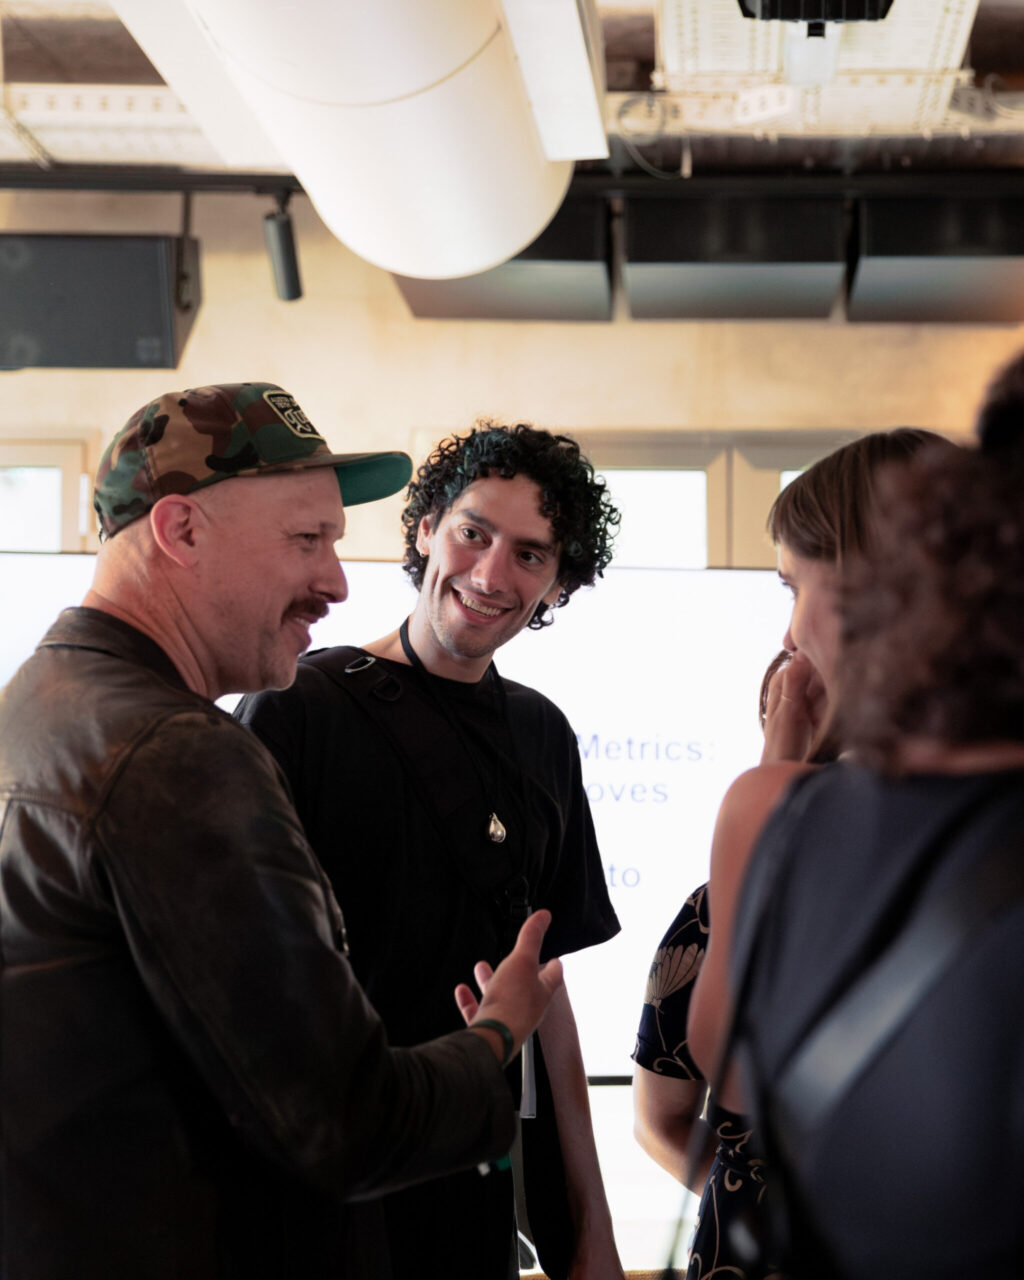
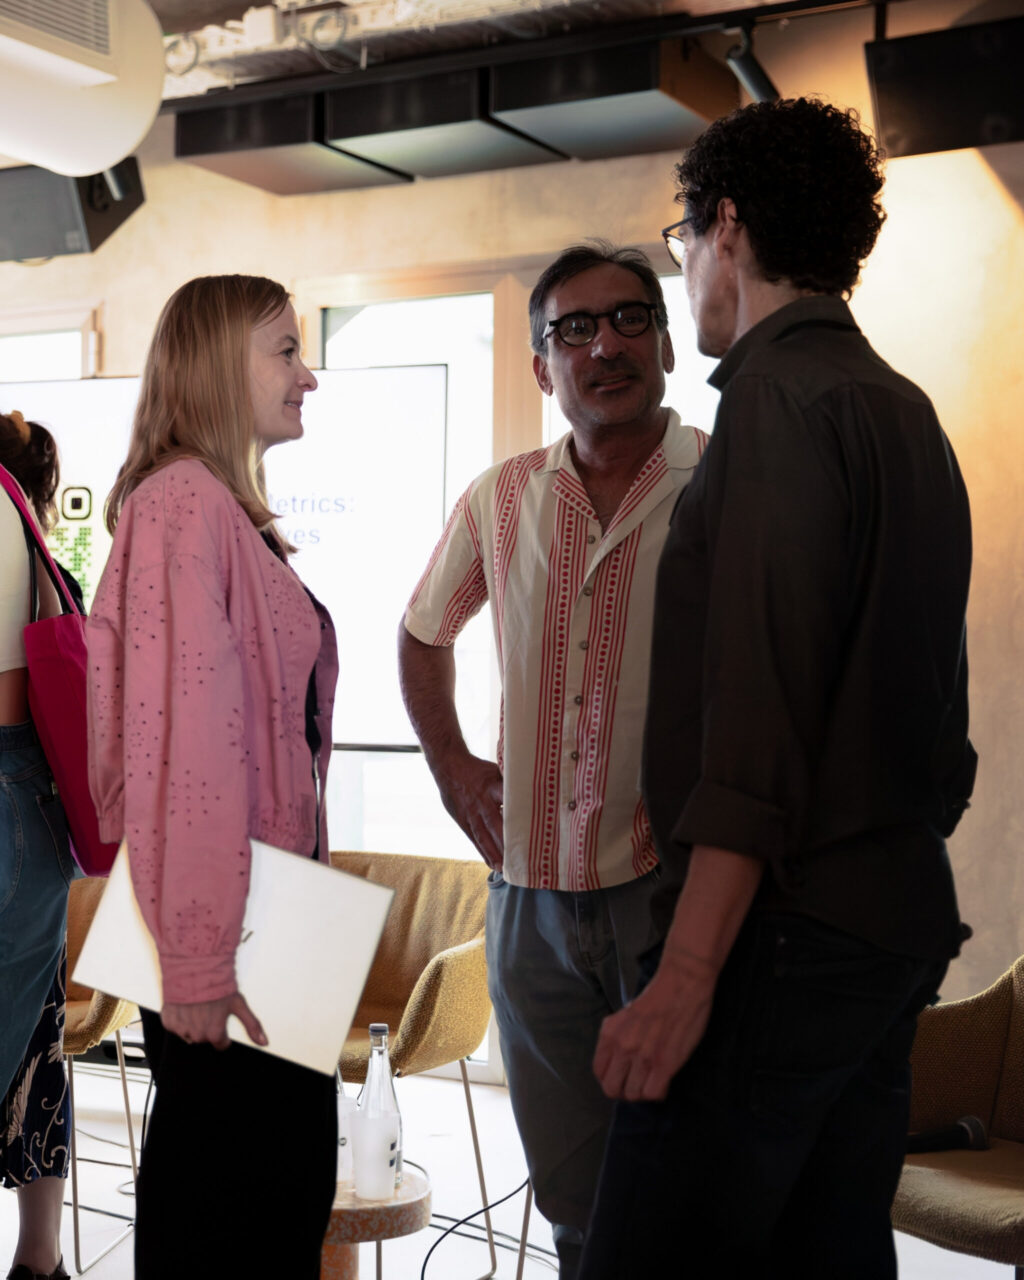
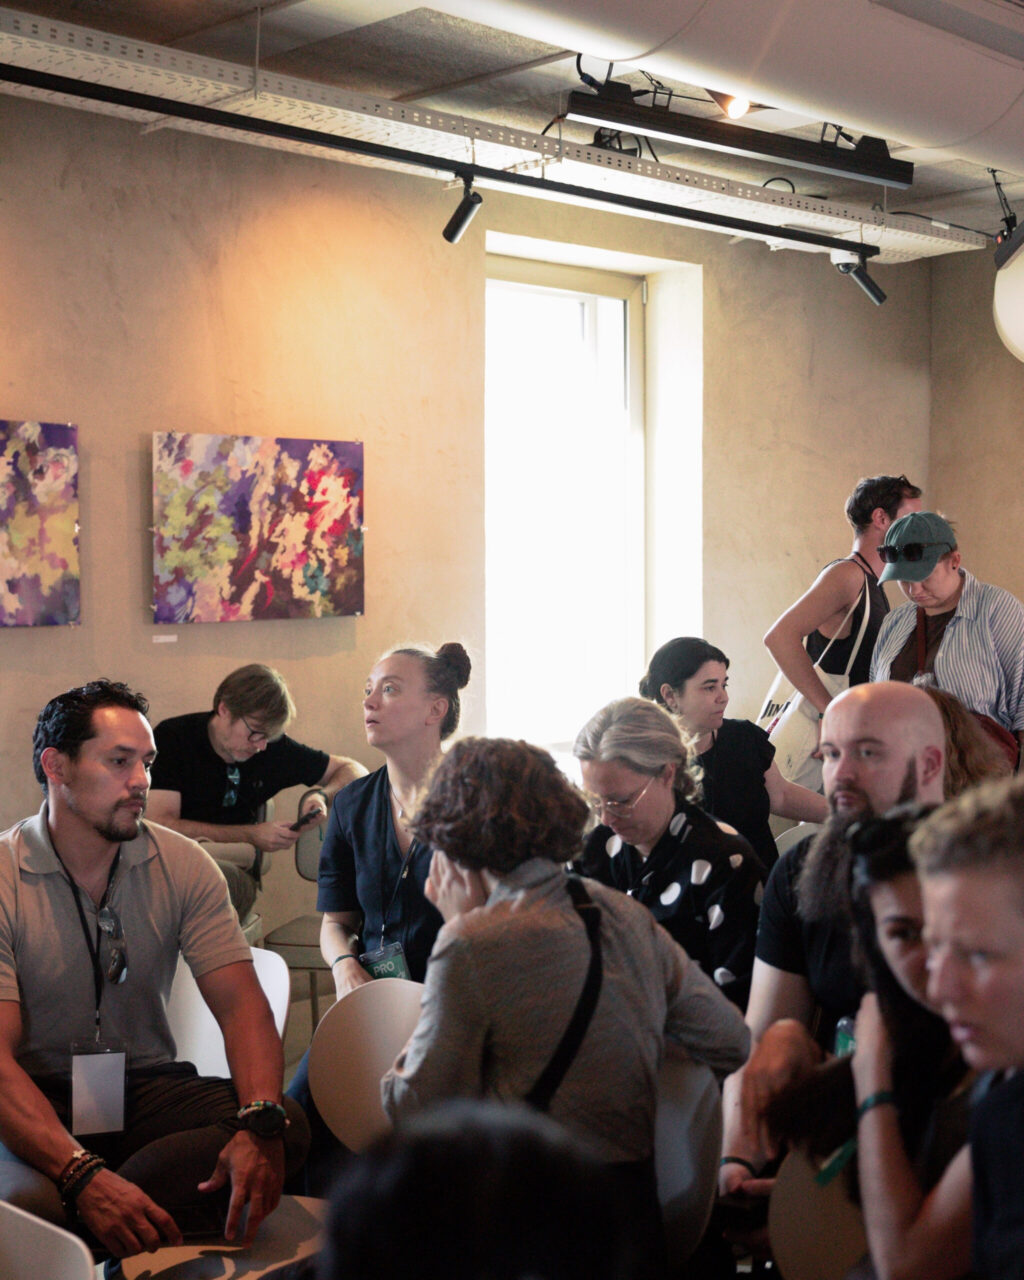
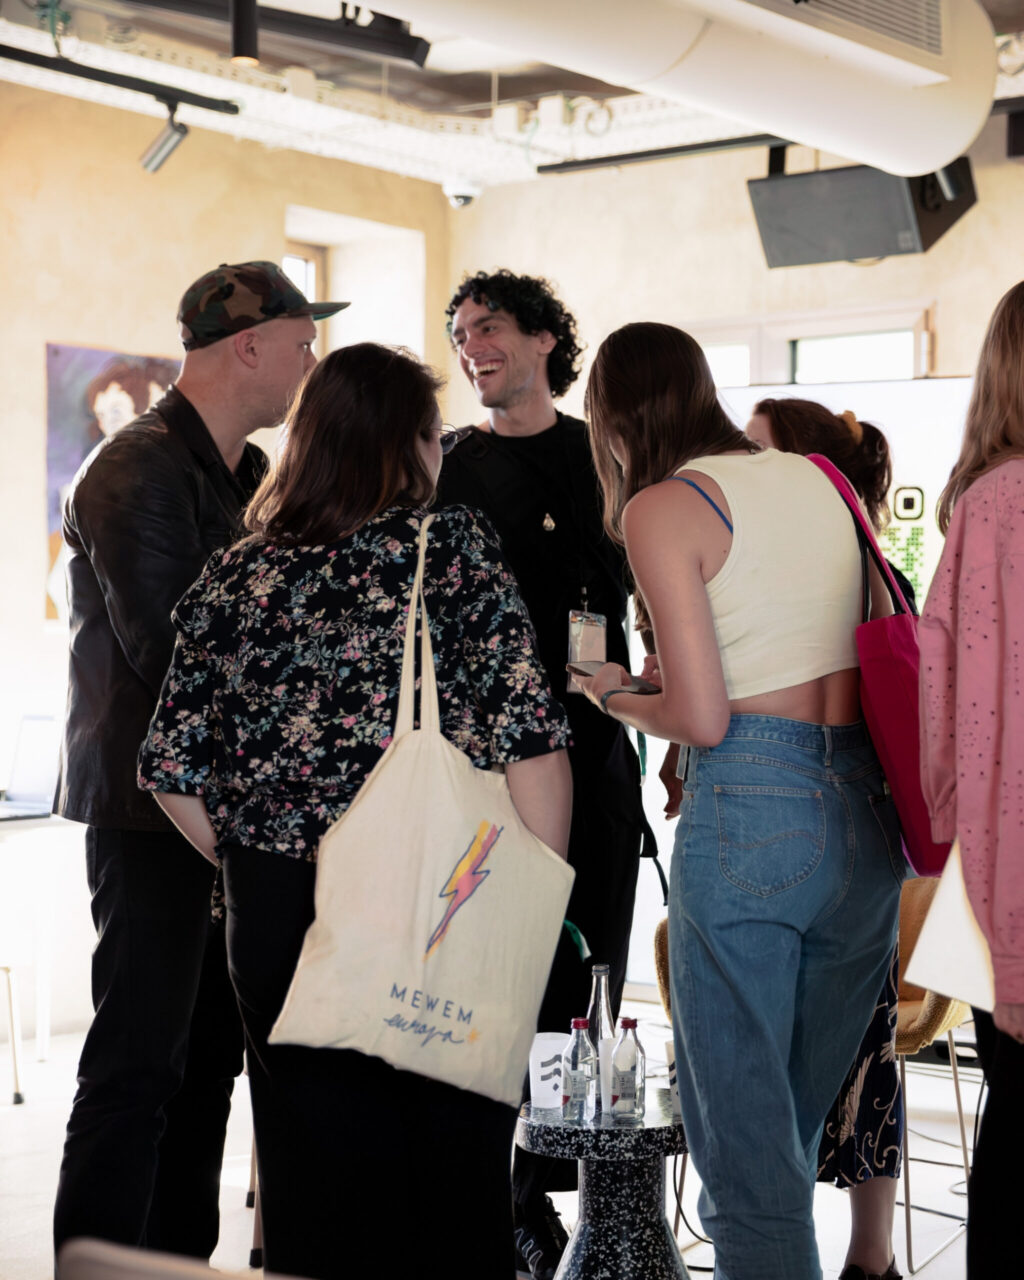
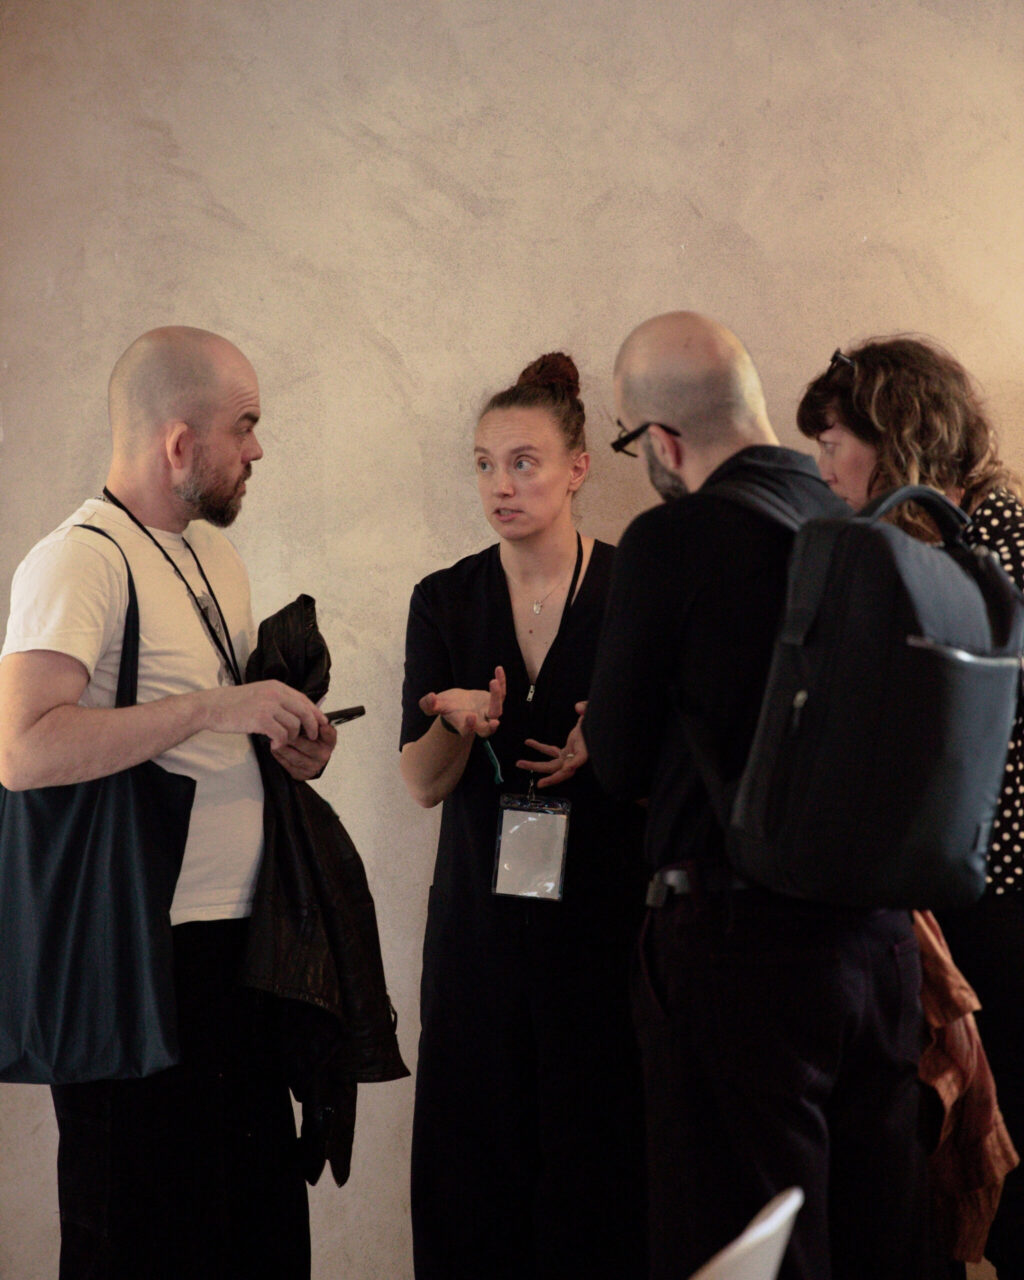
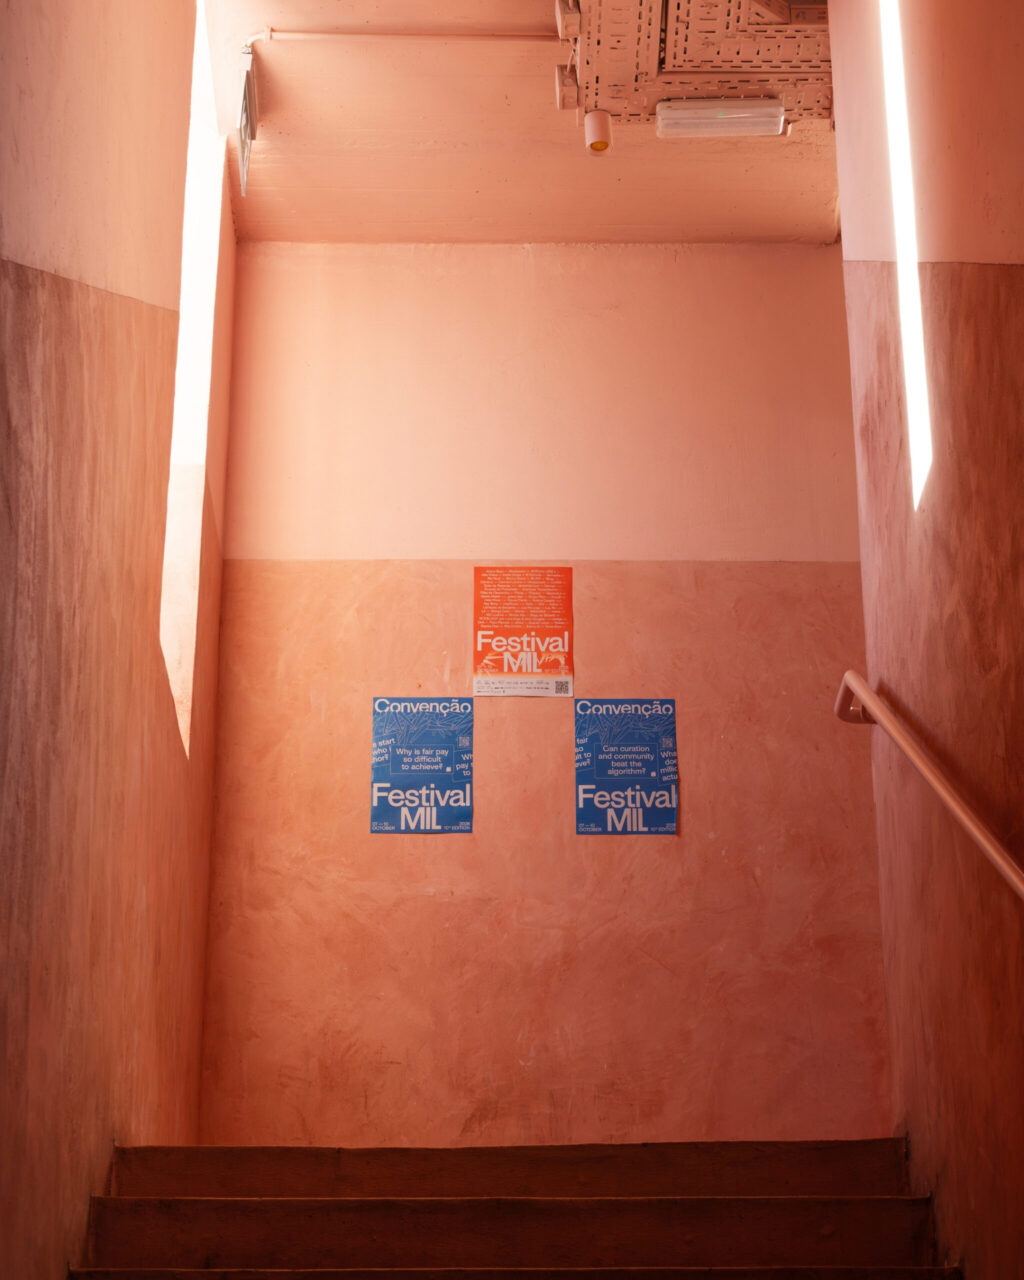
On 16 September 2026, two EXCENTRIC pilots took their work in progress to MIL Festival 2026 in Lisbon for the project’s second Open Demo Day, co-organised with Live DMA. Fondazione Romaeuropa and Cultural Trend Lisbon each led a 60-minute workshop. Each one combined a short case study from the pilot with an open panel and peer discussion among live-sector professionals.
Six weeks on, this article looks at what sits behind those sessions: the role Open Demo Days play in EXCENTRIC, and the data tools the pilots are building.
Where Open Demo Days fit
Open Demo Days are the public side of EXCENTRIC’s accelerator, the programme that takes the six pilots from diagnosis to working tools. Between public events, each pilot works in sprints with mentors and shares progress at internal Design Days. About every four months, an Open Demo Day takes that progress to the wider sector for feedback.
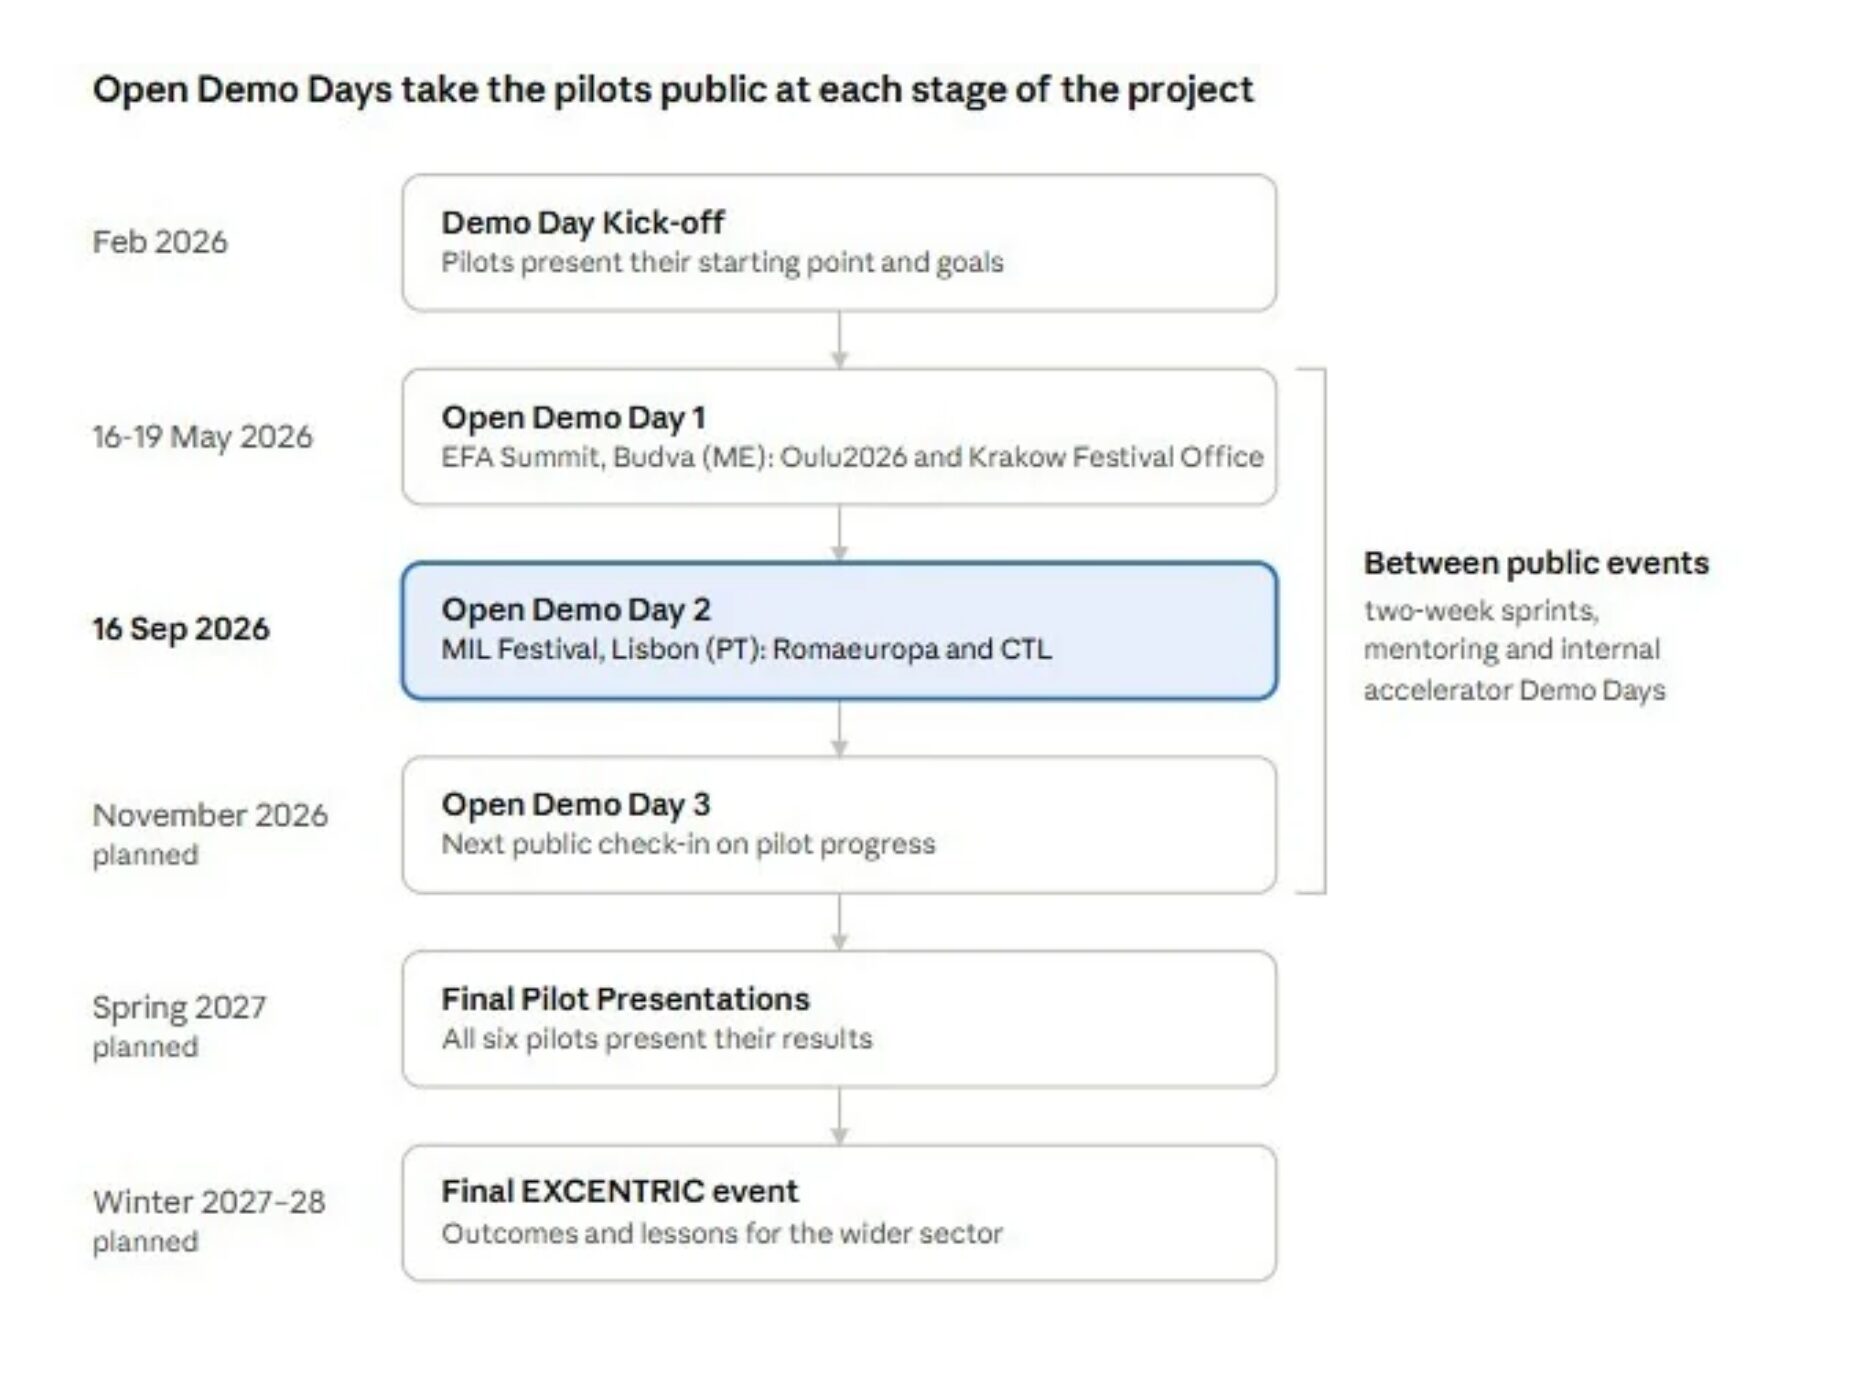
Open Demo Day 2 came at the midpoint of pilot implementation. That is why the pilots arrived in Lisbon with questions as well as results.
The accelerator works on four levels, and Open Demo Days connect all of them:
- The pilot. The organisation running the pilot, such as Cultural Trend Lisbon.
- The data sharing partner. Partner organisations that join a pilot to test it in a second setting, such as Sala Apolo in Barcelona.
- The constellation. All six pilots together, sharing what they learn.
- The Orbit. Outside experts who bring specialist knowledge and feedback. Speakers and guests at Open Demo Days are part of this circle. In Lisbon it included Keychange, L’Echonova and Festival Aqui ao Lado.
One shared infrastructure, six pilots
Every EXCENTRIC pilot faces a different challenge, but they all build on the same technical foundation. Waag Futurelab coordinates its development. When the project began, the pilot organisations were managing their data in everything from Excel to SQL databases, sometimes differently in each department. The infrastructure has four parts that address that:
- Adaptable data models. Shared ways of describing data such as tickets, audiences, artists and programmes. Data from different tools and organisations can then be read in the same way, without forcing a single vocabulary on the whole sector.
- Solid Pods. Each organisation keeps its data in its own pod, a personal data store based on the open Solid standard. It holds and controls its own data instead of handing it to a platform.
- Fair data governance. Before anything is shared, the organisations involved agree what data, at what level of detail and for what purpose. Sensitive personal data is shared only in aggregate.
- Tools on top. Analysis, indicators and, where useful, predictive tools are built on the data, along with training resources so staff can use them in daily work.
At the Open Demo Day, Pourya Omidi of Waag summed up the principle: data sharing is a means, not the purpose. The purpose is for cultural organisations to own their processes, use data better and collaborate. The tools are developed as open source, and code and documentation will be published so that other organisations can adapt them.
The tools in the two pilots shown in Lisbon
Cultural Trend Lisbon: a prototype for diversity indicators
CTL, which runs MIL Festival and the Casa Capitão venue, has measured gender balance in its programming for years. More recently it has also measured ethnicity, using voluntary self-identification. Its EXCENTRIC pilot turns that practice into a tool. After a year to a year and a half of groundwork, a prototype is now being tested. It works in four steps:
- Ingest. Data from DICE ticketing, the forms artists fill in before each performance and CTL’s own spreadsheets is mapped onto a shared vocabulary and loaded into CTL’s Solid Pod.
- Analyse. Indicators sit on top of the data, so CTL can track progress against its goals every year. The first indicators include gender pay gaps and whether non-male artists are being booked mainly in smaller venues.
- Share. CTL gives a partner access to selected data under agreed conditions. Sala Apolo in Barcelona, which collects less data than CTL, is the first partner to go through this process.
- Compare. Partners can run the same indicators, or define their own, side by side.
The tests now under way check three things: whether the tool is practical enough for daily use, whether CTL’s data can feed in directly, and whether the chosen indicators are the right ones. The indicators were developed with Carmela Milano, an expert on social indicators.
More Than Metrics — How Data Moves From Spreadsheet to Stage
Romaeuropa: a unified view of audiences
Romaeuropa Festival sells tickets through several channels, each recording data in its own format. Its pilot, Targeted Audience Growth & Dynamic Pricing, is building a single standard for that ticketing data, stored in the festival’s own Solid Pod. On that foundation the pilot is developing audience segmentation, to see who comes to which strands of the programme and who is still missing, starting with people under 35. It also supports data-informed pricing decisions per show and per audience.
The pilot has already changed how the festival works. Focus groups and questionnaires run within the pilot showed that young people want to be involved rather than marketed to. Romaeuropa has since replaced its annual marketing plan with a community engagement plan. The data tools are designed to sit alongside that qualitative listening, not to replace it.
Stop Guessing, Start Listening — Methods That Shift Festival Curation
What we learned in Lisbon
Five lessons came out of the two sessions. They apply well beyond the two pilots.
- Start with a question, not a dataset. Waag’s advice to organisations starting out: “What do you want, with whom, and how?” Data without a clear question or assumption is hard to act on.
- Data informs decisions; it doesn’t make them. Programmers on both panels use charts, streaming figures and ticket sales, but check them against their own judgement. Romaeuropa brought back an artist whose first show had sold 74 of 174 seats, because it trusted his live performance.
- Young audiences want to take part, not be targeted. Romaeuropa, L’Echonova and Festival Aqui ao Lado reached the same finding in different ways: open calls, youth committees and community conversations work better than more social media content.
- Accurate data needs a validation process. CTL’s experience with figures estimated from photos, and Keychange’s shift from counting bands to counting individual musicians, both showed how much the method changes the result. Self-identification is essential for diversity data.
- Listening only works if the organisation is willing to change. Several guests described internal resistance as the biggest barrier. Romaeuropa’s switch from a marketing plan to a community engagement plan showed what that change can look like in practice.
What’s next
The two pilots are tackling different challenges: Romaeuropa is working on audience engagement, and CTL on diversity measurement. Both reached the same conclusion in Lisbon: data is useful when it answers a clear question and leads to a decision. Romaeuropa will continue rolling out its community engagement plan. CTL and Sala Apolo will finish testing the prototype and refine the indicators.
Both pilots, along with the rest of the EXCENTRIC pilots, will report on their progress at the next events. Their results will feed into the Collaborative Data Practice toolkit being developed for the wider cultural sector.
Follow the pilots. If you couldn’t join us in Lisbon, you can subscribe to EXCENTRIC news for pilot updates. You can also follow us on LinkedIn and Instagram, or listen to the EXCENTRIC podcast.
Thank you MIL Lisbon!


More Insights